筛选结果 共找出469

Which of the following can be included when valuing inventory?

(i) Direct material

(ii) Direct labour

(iii) Administration costs

(iv) Production overheads

A

(i) and (ii) only

B

(i), (ii) and (iv)

C

(i), (ii)and(iii)

D

all of them

Which of the following is usually classed as a step cost?

A

Supervisor's wages

B

Raw materials

C

Rates

D

Telephone

Which of the following is not a cost objects?

A

a cost centre

B

a customer

C

a manager

D

a product

Which of the following describes depreciation of fixtures?

A

not a cash cost so is ignored in the cost accounts

B

part of overheads

C

part of prime cost

D

is a cash outflow

Which of the following costs would NOT be classified as a production overhead cost in a food processing company?

A

The cost of renting the factory building

B

The salary of the factory manager

C

The depreciation of equipment located in the materials store

D

The cost of ingredients

There is to be an increase next year in the rent from $12,000 to $14,000 for a warehouse used to store finished goods ready for sale. What will be the impact of this increase on the value of inventory manufactured and held in the warehouse?

A

an increase of $14,000

B

a decrease of $14,000

C

no change

D

an increase of $2,000

The diagram represents the behaviour of a cost item as the level of output changes:Which ONE of the following situations is described by the graph?


A

Discounts are received on additional purchases of material when certain quantities are purchased.

B

Employees are paid a guaranteed weekly wage, together with bonuses for higher levels of production

C

A licence is purchased from the government that allows unlimited production

D

 Additional space is rented to cope with the need to increase production

The data may be illustrated by the following chart. What type of chart is it?
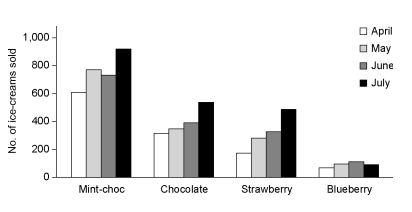
A

Simple bar chart

B

Multiple bar chart

C

Component bar chart

D

Ogive

Which one of the following statements is true?

A

Sales of mint choc chip rose steadily over the four months

B

Total sales fell in the month of July

C

In June, the gap between sales of strawberry and sales of chocolate reduced

D

Sales of blueberry rose in May and July

The table below shows a company's sales figures for the first six months of the year.What kind of graph or chart would you use to show the fluctuations of total monthly sales figures across the six months?

A

Percentage component bar chart

B

Scatter diagram

C

Line graph

D

Pie chart